Assessing the Economic Damage of the COVID Crisis Four Months In
August 12, 2020
Key Takeaways:
- While Massachusetts had one of the strongest regional economies in the country before the COVID crisis, unemployment in Massachusetts is now the highest in the nation.
- While there was a general decline through late May and early June for self-reported economic anxiety around the possible future loss of income, this anxiety is rising again in Massachusetts, especially among Black and Latino households.
- Nationally, the unemployment rate has declined across May, June and July, suggesting that the national economic collapse may have bottomed out. However, the unemployment rate decreased more slowly between June and July than the previous period, suggesting that new, secondary closures across the U.S. are now showing up in the data. Still, though these improvements are meaningful, they only partially offsets the major losses from March and April. The Congressional Budget Office estimates it might take a decade to fully recover.
- Even as the overall unemployment rate dropped across the summer, unemployment among Black, Asian and Latino Americans remains higher and dropped more slowly than for white Americans.
- Due to measurement challenges related to furloughed workers, official unemployment rates from the Bureau of Labor Statistics likely understate actual unemployment by as much as 5 percentage points.
Faced with a fast-growing public health crisis and woefully inadequate national pandemic preparation, we did the right thing by shutting down huge swaths of our economy that relied on face-to-face interactions. The painful consequence has been massive job losses that for many weeks straight have broken every record set before this crisis hit. So much so that graphs of weekly unemployment claims have literally jumped off the charts.
Concerningly, despite a multi-week decline in unemployment claims since March 28th, the week of June 6th saw a 65 percent increase in claims as compared to the previous week. Claims have again declined through August 6th and have now fallen to around the number of claims reported during the heights of the Great Recession.
While the shape of the above graph looks almost identical for the country as a whole, Massachusetts has been particularly hard hit. For many years, our local economy was stronger, and beginning in mid-2007 we had consistently lower unemployment than the national average. But this has since changed—now Massachusetts has a higher unemployment rate than the nation as a whole, and in June, a higher rate than every other state.
It’s important to note that our elevated unemployment rate is likely the result of two things: 1) an especially severe early COVID-19 outbreak; and 2) an extended economic and societal shutdown that lasted longer than in many other states. While far from perfect, our state response during those early months may be why our COVID case rates are now much lower than in many states. If we can keep case rates at this lower level, we may end up enjoying a more enduring economic recovery, even if it takes longer to settle in.
The absolute level of these unemployment rates is almost certainly understated as well. Due to the unique nature of this economic shutdown, some furloughed workers appear to have been misclassified in the Bureau of Labor Statistics’ survey and not counted as unemployed. As result, the actual U.S. unemployment rate may have been around 5 percentage points higher in April, 3 percentage points higher in May, and 4 percentage points higher in June. Our state unemployment rate is likely understated by a similar amount.
We’ve also continued to glean insights from the weekly Census Bureau survey measuring household experiences during the coronavirus pandemic, called the Household Pulse Survey. One particularly compelling measure we've analyzed assesses people’s self-reported concerns about possible future loss of income. The first few months of data show that while there was a general decline in economic anxiety in early-May, anxiety increased again in Massachusetts during late May and early-June, especially among Black, Asian, and Latino households. Despite some recent declines, levels of economic anxiety generally remain high, particularly among people of color.
For the most recent survey period, 29 percent of respondents statewide expected someone in their household to lose employment income over the coming four weeks. That share jumps to 36 percent for Black respondents and 38 percent for Latino, though anxiety among these groups is notably lower than it was a few weeks prior.
The nationwide Pulse Survey has been surveying tens of thousands of people each week during the COVID-19 pandemic. The survey relies on the Census Bureau's Master Address File, which provides a strong platform for distributing the questionnaire. However, the survey is an experimental tool that continues to be refined. The response rate has been quite low (between one and four percent of surveyed households), so standard errors tend to be large when disaggregating by smaller geographies and by race. This is why here we present this data only for Massachusetts and not also for Boston. Even still, these survey data should be interpreted with a bit of caution. For more information, please refer to the Census Bureau's technical documentation, which can be found here.
Compounding the economic pain that has already been felt is the fact that many people who’ve lost their jobs during this crisis are people who were already in high-risk categories to begin with—e.g., lower-wage workers and undocumented immigrants with limited access to critical public supports. By far the largest job losses have been in in Food Service & Accommodation and Retail, sectors that tend to be made up of lower-wage service jobs.
That said, Massachusetts is seeing job losses across all industries. It’s striking that over 140,000 people working in Healthcare & Social Assistance have filed for unemployment. At first blush, this seems like one sector that would be more sheltered from immediate risk of job loss, but even hospitals are laying off workers who are not on the front lines of responding to COVID-19. While this is starting to change, health sectors like dentistry and chiropractic are only now opening up with significant restrictions.
The data in the graph above reflects traditional unemployment claims and not additional claims for the Pandemic Unemployment Assistance (PUA) program created through the CARES act. Though the PUA program's last enrollment date was July 25th, it was a lifeline to people like gig economy workers and the self-employed, and as of July 18, had roughly 480,000 claimants enrolled across the state. Unfortunately, there has not yet been any expansion of these benefits, leaving many Massachusetts residents without the income they need to get by.
Another way to visualize the economic impact of the COVID crisis is by looking at data from OpenTable on the number of people eating meals at restaurants in its network (either through reservations or walk-ins). The graph below compares this data for a given week in 2020 to its equivalent week in 2019. Restaurants fully closed in Boston and Massachusetts roughly four days before those nationwide. Stay-at-home orders covered most of the United States for all of April, and so there was basically no one dining-in at any restaurants all the way into May.
On May 1, a steady uptick in seated dining nationwide began as some states reopened weeks before we did in Massachusetts. Recently however, following a surge in COVID-19 cases across the South and West, restaurant dining nationwide has plateaued once again. Some states that reopened restaurants relatively early--like Florida and Texas—have limited indoor dining once again. Seated outdoor dining opened in Massachusetts as part of Phase II on June 8th, with indoor dining following on June 22nd. Nevertheless, there does seem to be some limit on how willing people are to go back to restaurants. Since about July 4th, the rebound in restaurant dining has plateaued, both locally and nationwide.
In May, the Harvard-based research center Opportunity Insights launched an Economic Tracker that combines widely-used public data with real-time economic data from a variety of private sector sources not usually available to the general public—e.g., data from payroll processors, financial service firms and e-commerce outlets. Taken together they facilitate more real-time monitoring of the effects of the COVID crisis nationwide and down to the metro level.
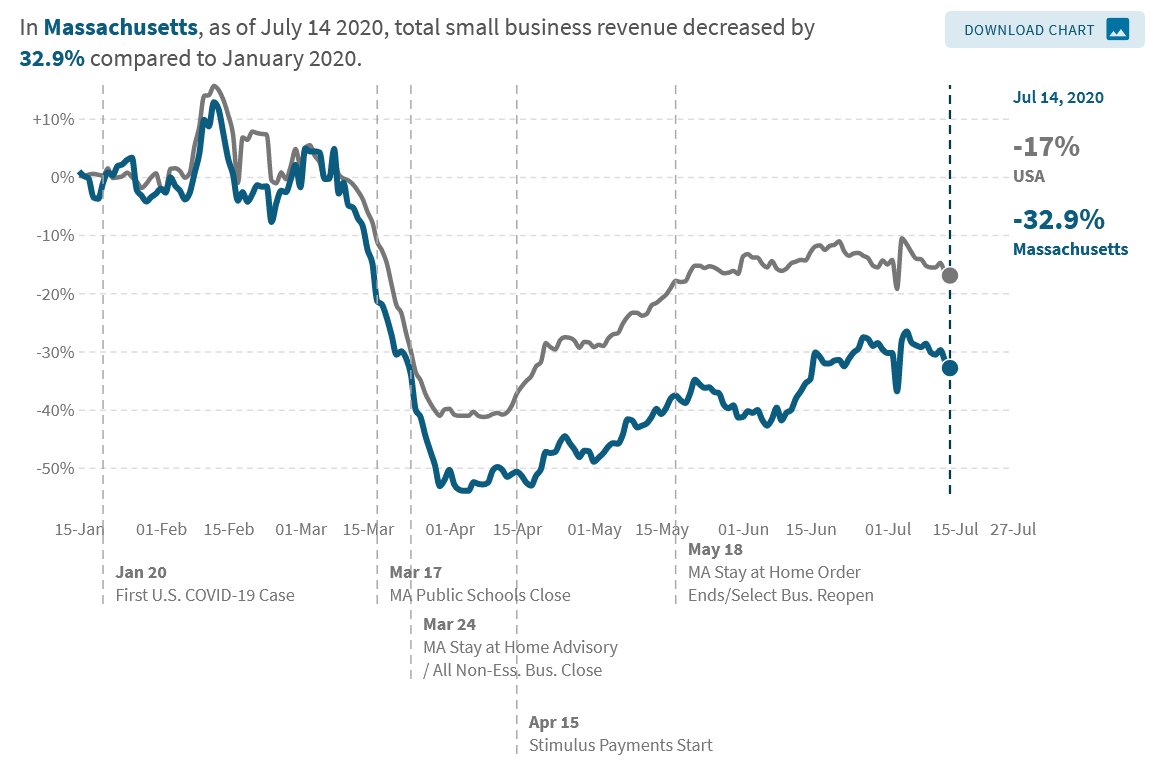
The economic slowdown has been dramatic and widespread across a range of dimensions including employment rates, hours worked, job postings and a few others. The graph below shows small business revenue in Greater Boston compared to the country overall. Small business revenue dropped sharply everywhere, as the rapid closure of the economy has been especially challenging for smaller firms. But while revenue has increased across the U.S. as some states have begun reopening, the graph shows that with greater virus spread and stricter lockdowns, Greater Boston and Massachusetts have been hit harder than much of the rest of the country. As of July 27th, small business revenue in Massachusetts was down 32.9 percent compared to early January. Even though the state has seen some dips in our recovery of small business revenue since early May, the state largely trended upwards towards pre-pandemic norms until around late June. With the state’s slower phased reopening, we’re not likely to see as immediate a bounce back the way we saw in states such as Texas. That said, Massachusetts’ slower reopening has proved somewhat beneficial. Since June 2nd, Texas’ own recovery has collapsed again, with small business revenue falling 15 percentage points by July 14th.

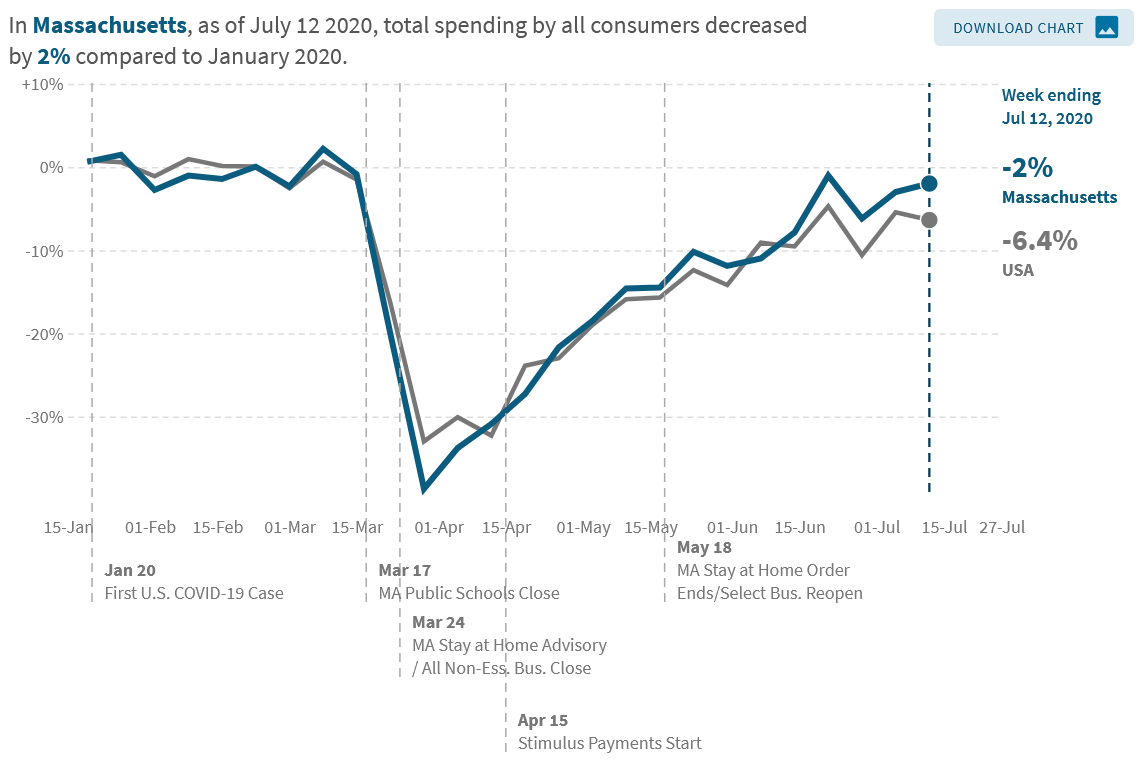
This data suggests that early April may have been a low point. Total consumer spending, which collapsed in April across both the United States and Massachusetts, rebounded significantly by early June. Since then, growth in small business revenue in Massachusetts – like the U.S. – appears to have plateaued. Still, stagnant small business revenue growth and increasing consumer spending suggest much of this spending is going towards larger corporations – rather than more local small businesses.

To see interactive presentation of these graphs and others, go to the Opportunity Insights Economic Tracker online.
