
While traffic is nearly back to pre-pandemic levels, public transit ridership is recovering more slowly.
By Peter Ciurczak
October 19, 2021
Transportation patterns have shifted dramatically over the course of the pandemic. After steep drops across all modes early on, the past several months have seen people return to roads, subways and buses, albeit at varying rates. We’ve been tracking these trends through the COVID Community Data Lab, and in this brief we look at current patterns a month or so out from the end of summer.
Key findings from this research include:
- Car travel has seen the greatest rebound, with traffic levels outside of the urban core sometimes exceeding 2019 levels.
- As many employers continue different work-from-home patterns, public transportation ridership remains below pre-pandemic levels, particularly on Greater Boston’s subway lines. However, the Blue Line and MBTA buses, which largely serve lower-income residents of color, have consistently retained more of their ridership than other lines.
- Ridership on many of the state’s Regional Transit Authority (RTA) bus systems have rebounded even more significantly, led by the Worcester RTA, which is currently at over 90 percent of pre-pandemic ridership levels. This success is likely driven by an ongoing free bus pilot for the full WRTA system.
- Early in the pandemic ridership dropped most on the Commuter Rail, running at or below 10 percent of its pre-COVID levels for much of 2020. Federal recovery money has helped restore service frequency leading to some rebound over the past several months, with the Providence/Stoughton and Newburyport/Rockport Lines retaining the greatest number of riders.
Road Traffic
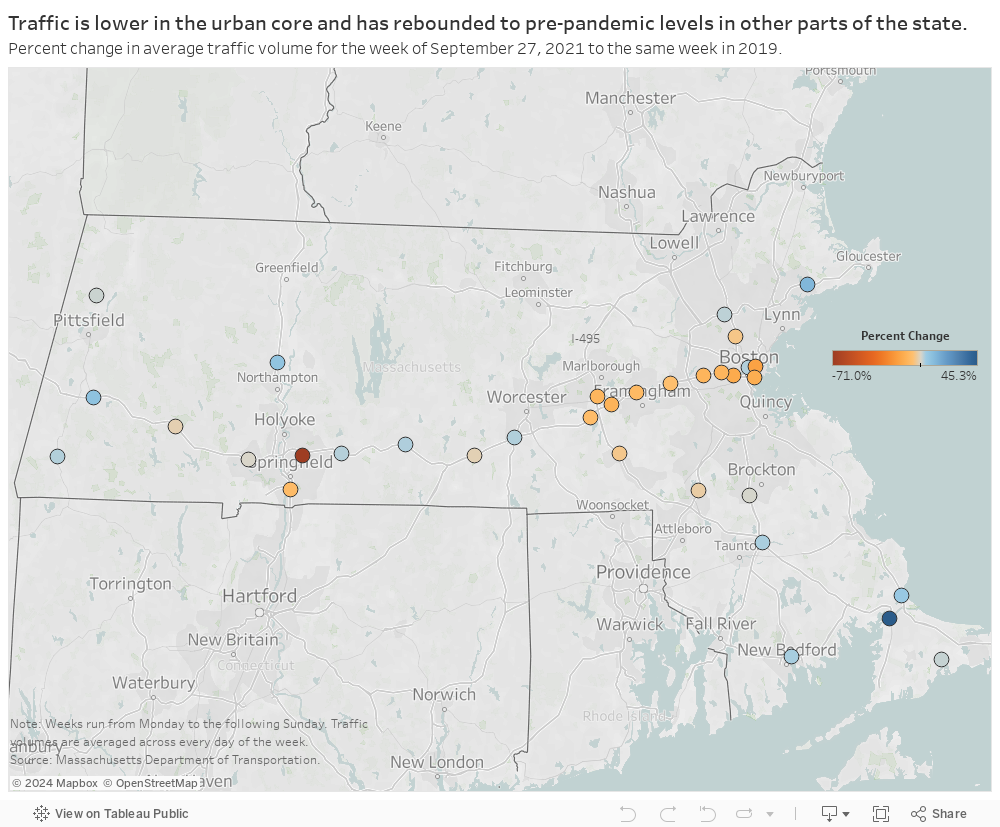
While road traffic dipped dramatically early in the pandemic, it has rebounded more quickly than other modes. As of the week of September 27, traffic outside of Route 495 now sometimes exceeds pre-pandemic levels. Within the 495 boundary, however, traffic remains a bit lower as many Boston-based employers postponed returning to work due to spread of the Delta variant. Nevertheless, traffic across the core is down just 3 to 18 percent as compared to 2019. The interactive map below details this clearly, measuring the percent change in weekly average traffic volumes in 2021 on select road gantries and comparing them to an equivalent week for 2019.
Highlighting the slower return of 9-5 workers to the city than to other areas, the series of graphs below shows average weekday traffic volume at 15-minute intervals heading east across four locations on the Mass Pike. Notably, the commuter peaks that we saw during the pre-pandemic week of March 2, 2020, have mostly been met or exceeded for locations west of Boston. At the Allston tolls, however, traffic remains a bit lower. Moreover, there remains the possibility that traffic growth is due to former transit commuters switching to car commuting—and when offices truly open traffic may very well exceed pre-pandemic levels.
West of Boston, traffic on the Pike is largely back to pre-pandemic levels.
Average weekday traffic volume heading east at 15-min intervals.
MBTA Transit Ridership
While it’s steadily increased over recent months, public transit ridership in Greater Boston remains around 50 percent below pre-pandemic levels. Ridership also continues to vary greatly by line or mode, with the steepest ridership losses coming on the Silver, Red and Green Lines.
Across the pandemic, buses and the Blue Line have retained the most passengers, and are currently at 70 and 60 percent of their early March ridership. Indeed, with the sole exception of May 2020, as parts of the line were under repair, Blue Line stations retained greater ridership on average than stations on any other line. This is likely driven by the fact that higher concentrations of lower-income frontline workers who depend upon bus transit live along these routes.
The tool below drills down deeper into these trends, showing how many people entered a given station, and compares these monthly entrances with equivalent pre-pandemic months.
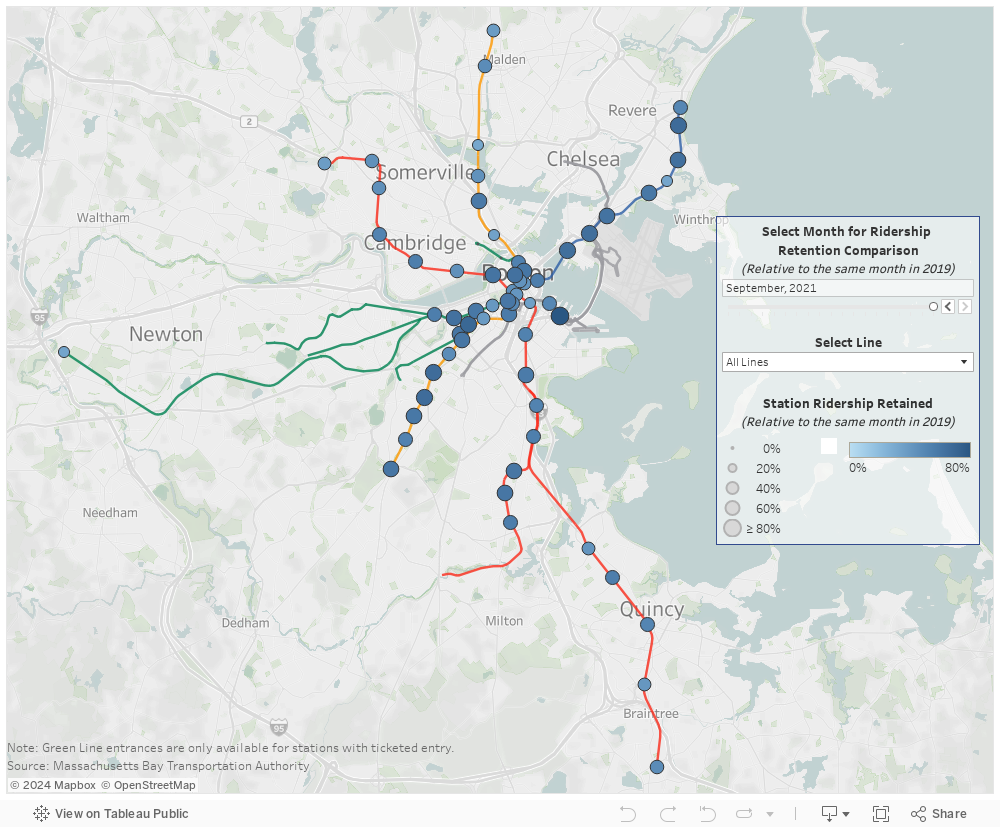
This tool reveals additional patterns. As the pandemic continued, station entrances picked up more consistently across the Red and Orange Lines south of the downtown core (excluding the Red Line’s Braintree branch). Many of these stations, like those on the Blue Line, serve higher concentrations of low-income workers. Indeed, across the MBTA the stations that saw more service during the pandemic were also those used by greater concentrations of these workers.
By contrast, stations that serve workforces more capable of working from home have consistently seen lower ridership. This is particularly evident when looking at station entrances for the Red Line west of Charles/MGH. All of these saw a ridership collapse at the outset of the pandemic, and for months afterwards regularly served around 20 percent of their 2019 ridership. Only since June 2021 has ridership at these stations appeared to meaningfully increase, with a few stations breaking 50 percent of their 2019 entrances by September 2021. These increases are also likely helped along by more university students returning to in-person classes. Still, though higher as compared to the rest of the pandemic, ridership at these stations remains quite low.
Commuter Rail Ridership
Alongside the MBTA’s buses and subways, commuter rail ridership has also picked up, albeit more slowly. The commuter rail system served an average of around 33,000 weekday trips as of August 2021—about 29 percent of February 2020’s weekday average. Breaking these riders out by line is a more complicated endeavor, but is possible for May data through a report presented at a Fiscal Management Control Board (FMCB) meeting in June. This report detailed line-by-line ridership retention comparisons for one week in May 2021 to weekday passengers in 2018. That chart, reproduced and expanded below, shows that the Providence/Stoughton Line retained the greatest number of riders.
Notably, while most lines had relatively similar retention levels, commuter rail lines running principally through lower-income, denser communities retained overall higher shares of their ridership. The Fairmount Line is a good example of this dynamic. The route is carrying roughly the same number of passengers as some other lines even as its overall baseline ridership is much lower than these other routes. Because of this, Fairmount’s pandemic ridership is about 39 percent of its pre-pandemic baseline. Patterns we’ve seen throughout the pandemic are likely contributors here, where lower-income workers that live along the Fairmount Line and other inter-urban routes often must continue to work in person, resulting in higher retention along these routes. Other commuter rail lines that ran through higher-income suburbs like the Framingham/Worcester Line have seen much lower ridership retention.
It’s worth noting too that service frequency on the commuter rail is quite different than it was pre-pandemic. As many 9 to 5 commuters began working remotely due to COVID-19, ridership cratered during the regular AM and PM peaks. Recognizing that the typical pre-pandemic scheduled service was no longer appropriate for pandemic riders, the MBTA was able to smooth departures so they take place throughout the day to better meet the needs of those who did continue to ride. These scheduling adjustments may have helped bring more riders back to the commuter rail over the last couple of months.
Regional Transit Authority Ridership
Outside of the commuter rail, most public transportation needs beyond Greater Boston are provided by Regional Transit Authorities (RTA) bus service. And these lines have seen relatively high levels of ridership retention. Notably, the Worcester Regional Transit Authority (WRTA) has consistently retained the largest share of riders—running from 10 to 30 percentage points above the RTA average since last summer. This likely is a result of the WRTA’s decision to make the system free through the end of 2021, which has served the area’s low-income and essential worker community well. The WRTA is not the only authority to experiment with fare-free service. The City of Lawrence has sponsored free fares across three Merrimack Valley RTA routes since 2019, which has also likely had a role in helping ridership return to that system.
Restoring ridership to public transportation systems across the state may be a challenge, but a necessary one.
While car traffic continues to approach and occasionally exceed 2019 levels, ridership across the state’s transit networks remains below pre-pandemic norms. This is by no means ideal and is even more problematic in Boston. Pre-pandemic levels of automobile traffic made the city the most congested in the U.S. in 2019, even as many other commuters were using public transit to get to work. Returning fully to those levels of congestion or worse impacts access to jobs, housing and more.i Yet, there are ways to get commuters back on transit that are being piloted even now. The WRTA’s fare-free system has helped restore ridership on Worcester’s buses to near-2019 levels. Adopting fare-free policies across more bus lines, like Lawrence and Boston are piloting on select routes, could go a long way toward improving ridership. Employer-provided free or reduced cost MBTA passes might even get car commuters back on the T, as would enacting some form of congestion charge to put a price on the cost of driving. Frequent service and Charlie Card compatibility on the Fairmount Line has helped it retain nearly 40 percent of its regular 2018 ridership—higher than any other commuter route. Implementing a fully regional rail system that builds on this and other lessons from across the pandemic and applies them to the entire commuter rail system could further help return commuters to the train.
Ultimately, we must ensure service cuts and other changes don’t hinder the ability of networks to serve their communities. Reimagining how transit networks function may be key to making them work better, for more people, more frequently.
i. Congestion in the Commonwealth, Report to the Governor 2019. pg. 75