Disparate Regional Impacts of the COVID Crisis
By Anne Calef and Luc Schuster
With Tom Hopper, Calandra Clark and Lucas Munson, MHP Center for Housing Data; Peter Ciurczak and Trevor Mattos, Boston Indicators.
January 19, 2021
Greater Boston was hit hard during the first wave of the COVID-19 pandemic. In addition to the widespread outbreak of the virus itself, most of the region’s service sector was shut down for months, and unemployment soared for those who could not work remotely. Public transit ridership dropped by 90 percent. Some higher-income residents moved out of the urban core and downtown office space lay empty. Some of these disturbing trends reversed course over the summer and early fall, but many have worsened again this winter as economic support programs phased out and COVID rates increased again.
Over the past nine months, we have been tracking the best data sources we can find on these trends through the COVID Community Data Lab. A common dynamic across most domains is that the pandemic has hit lower-income and communities of color much harder than others. To be clear, this has been a tough period for everyone in Greater Boston. But some residents happened to be in lines of work that translated smoothly to remote settings, while others either worked in sectors that shut down entirely or they worked in frontline, essential jobs like health care and food service, which required them to risk infection by going to work every day.
The unique dynamics of this crisis have combined with preexisting social and economic problems in Greater Boston to make this current moment especially inequality-enhancing. Preexisting problems include worsening economic inequality and persistent residential segregation, both of which have stark racial dimensions. A long history of racially discriminatory wealth-building programs helped create a large racial wealth gap, and in recent decades certain economic policies have served to intensify income inequality across the board, including within racial groups. These economic policies on top of housing policies like past redlining and present exclusionary zoning have contributed to the residential segregation in our region, with many low-income households and households of color concentrated in a select few cities. By impacting low-wage earners hardest, the current crisis has acted as an accelerant of these preexisting challenges.
To help us better understand how the pandemic has affected Greater Boston, this paper is organized around six key findings related to how different parts of the region have experienced COVID-19 and its fallout:
- Layoffs have been highest in communities with larger shares of workers in low-wage service positions that cannot be conducted remotely.
- Financial insecurity and demand for social assistance is higher in Black, Latinx, and lower-income communities.
- Transit ridership is down, but significantly less so in communities that serve higher shares of frontline workers.
- Road traffic remains down in the urban core, but has risen elsewhere in the region.
- Housing has become especially unstable for lower-income families.
- In a rare trend, rental housing costs have declined in Boston while increasing in other parts of the region. Home sale costs have grown across the region.
Layoffs have been highest in communities with larger shares of workers in low-wage service positions that cannot be conducted remotely.
It is common for economic downturns to be more severe for the most vulnerable in a society, but dynamics of the current downturn have made this especially so. During the Great Recession, for instance, the housing market collapse had direct spillover effects that spread quickly across much of the whole economy. The current economic downturn, by contrast, is heavily concentrated in the service sector: People working in hospitality and food service are experiencing unemployment rates around 15 percent nationwide. Rather than incomes dropping uniformly across sectors, many lower-wage workers have been laid off entirely, while middle and higher wage workers have shifted to remote work. In fact, with fewer options for travel and leisure spending paired with income supports from the federal CARES Act, the personal savings rate has actually increased significantly during the pandemic, suggesting that the financial balance sheets of swaths of the American workforce are actually better off during this crisis. This was not the case during the Great Recession.
The unique features of this economic crisis combined with preexisting patterns of residential segregation by income and race have led to huge disparities in unemployment rates across Greater Boston. As of November, communities including Lawrence, Brockton and Lynn had unemployment rates well over 8 percent, whereas high-income suburbs like Concord, Lexington and Lincoln had unemployment rates of only around 5 percent. This disparity was even more pronounced earlier in the pandemic, before the economy had rebounded at all; in June, for instance, unemployment in Lawrence was more than three times as high as it was in Concord (33 percent versus 10 percent).
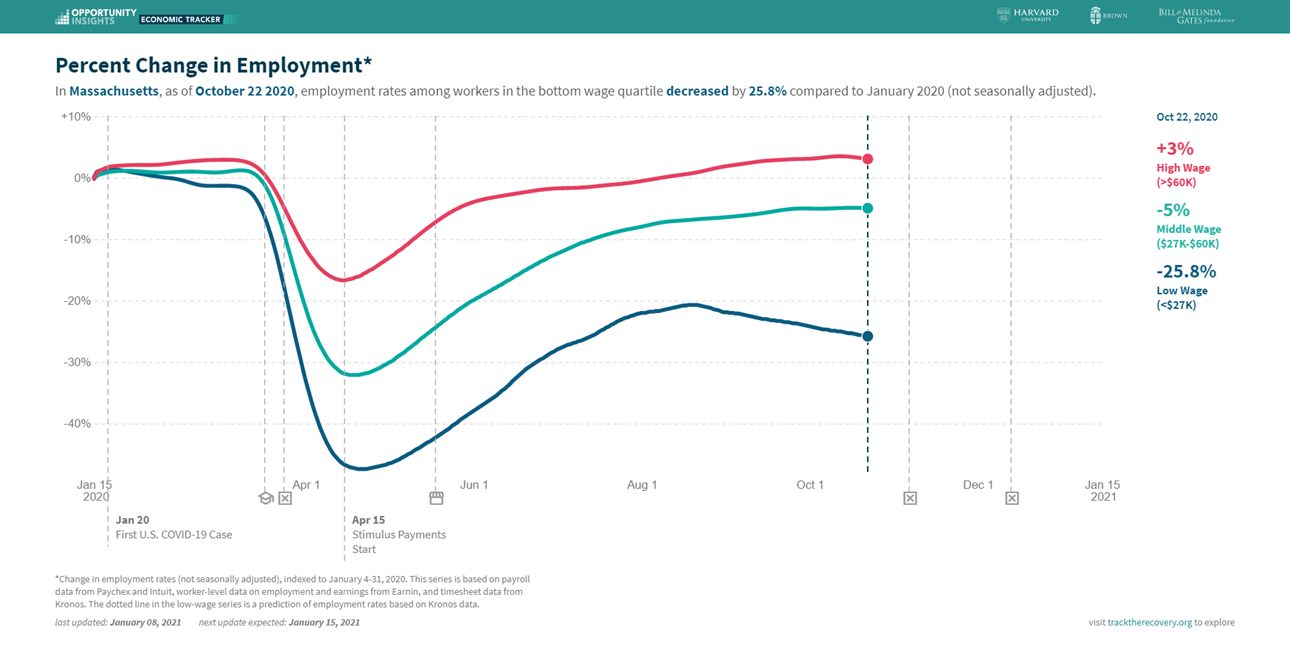
New research from Opportunity Insights allows us to track estimates of what these economic trends during the pandemic have looked like for different points in the wage distribution. While the top third of the wage distribution in Massachusetts is actually back above pre-pandemic employment levels as of late October 2020, the bottom third remains more than 25 percent below
For a portion of our local workforce, employment has remained relatively stable. In fact, at 42 percent, Massachusetts has a higher share of jobs that can be conducted remotely than any other state in the country, according to estimates from Ole Agersnap (2020). Despite this, there’s still variation across the type of work, as shown in the graph below. “Educational Services” and “Professional, Scientific and Technical Services” are two sectors with over 70 percent teleworkability. Other sectors such as “Health Care,” “Retail Trade” and “Accommodation and Food Services” still employ a significant portion of our local workforce and are largely not amenable to remote work.
The share of residents working in these different sectors varies widely by community, as shown in the map below. A high percentage of workers living in, say, Concord are employed in “Professional Services”, while a higher share of Chelsea residents are employed in “Food Services.” We see large shares of suburban communities to the west of Boston in teleworkable jobs, with fewer in these sorts of jobs in other parts of the region, especially to the north and south.
Due to the specific industries that have been hit, the strain that the pandemic has placed on parents, and the continued, gendered distribution of child care, job loss has been dramatic for women, particularly for women of color. In December 2020, on net all of the jobs that were lost were “women’s jobs.” Many women work in sectors, such as leisure and hospitality, where jobs have not returned, causing large shares of unemployed adult women, especially women of color, to be out of work for six months or longer. Overall unemployment rates for Black and Latina women are particularly high, 8.4 and 9.1 percent, respectively, well above the 5.8 percent unemployment rate for White men and the 6.3 percent unemployment rate for White women. The lack of child-care options due to remote schooling, public health measures, and day-care center closures has also squeezed working mothers. According to a national panel study of working parents, one out of four women reported becoming unemployed due to the lack of childcare, twice the rate among men. This translates to a large setback for women the workforce – as of December 2020, there were roughly 2.1 million fewer women in the labor force than in February.
Financial insecurity and demand for social assistance is higher in Black, Latinx and lower-income communities.
Food insecurity and economic anxiety are elevated across the state but are much higher for Black and Latinx households. The Census Bureau’s Household Pulse Survey has provided key data to understand how US households are faring during the pandemic. However, due to the limited sample size, we cannot analyze data at the town level. Looking at data from a statewide perspective, we see that while all families are struggling in unprecedented ways, food and financial insecurity is concentrated in Black and Latinx communities. Black and Latinx households experienced higher rates of food insecurity than White and Asian households before the pandemic, and those differences have continued during the crisis. Before the pandemic, food insecurity in Black households had actually been declining but in 2020 the trend was interrupted and the rate more than doubled.
Financial insecurity in Massachusetts has also been widespread, with nearly one in three adults statewide having trouble paying for usual household expenses in November and December. When asked how difficult it had been for their household to pay for usual household expenses in the last seven days, 32 percent of Massachusetts adults responded “somewhat” or “very” difficult. The rate was even more dramatic for Black and Latinx adults who reported much higher rates of financial insecurity than White and Asian adults. A staggering 55 percent of Black and 44 percent of Latinx adults had trouble paying for usual household expenses in November and December 2020.
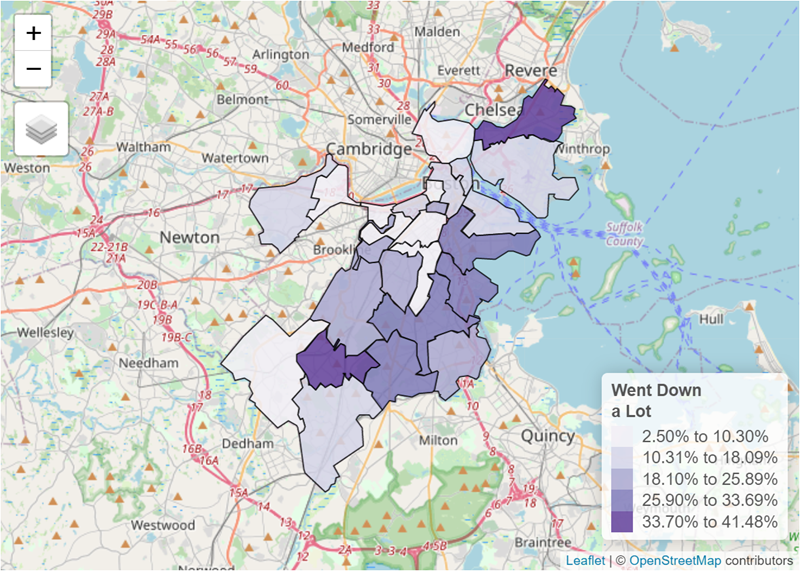
Differences in economic hardship are also widespread within the city of Boston itself. The Boston Area Research Initiative (BARI) found in its NSF-Beacon survey of 1,626 Bostonians that there were “stark differences in economic impact between Boston’s neighborhoods,” and lower-income communities with higher shares of residents of color more likely to report higher losses of income. As seen below, the East Boston/Orient Heights neighborhood in the north and Roslindale neighborhood in the south reported the highest income loss, with Hyde Park, Mattapan and Lower Roxbury neighborhoods also reporting higher income loss than other areas in the city.
Income loss during the pandemic varies greatly by neighborhood.
Share of survey respondents who said their income "went down a lot."
As with other key findings, the geographic spread of income loss reported by the BARI study shows an exacerbation of pre-pandemic disparities. Many of the areas that experienced large income loss are the same areas of the city with the lowest median incomes, with the notable exception of areas typically dominated by university students such as near Northeastern University. Hard hit East Boston/Orient Heights Census tracts had median incomes ranging from $42,000 to $57,000, while areas that experienced less income loss, such as the Seaport, had median incomes upwards of $130,000.
Requests for social assistance are also higher for areas with lower incomes and higher shares of Black and Latinx residents. According to 2-1-1 Counts, a project begun at Washington University in St. Louis to track and summarize calls to the “2-1-1” social services hotline, the ZIP codes with the highest rates of housing and shelter requests in Massachusetts came from Dorchester, Roxbury, Lynn and Springfield (zip codes with less than 30 total requests were removed). Many of the same ZIP codes emerged when looking at rates of request for food, health care and employment-related assistance, showing high demand for many forms of social assistance in these communities. The 2-1-1 call data nearly mirrors the Urban Institute’s Emergency Rental Assistance Priority Index that estimates the level of need in a given census tract by incorporating instability risk factors, the economic impacts of the pandemic and neighborhood demographics.
Transit ridership is down, but significantly less in communities that serve higher shares of frontline workers.
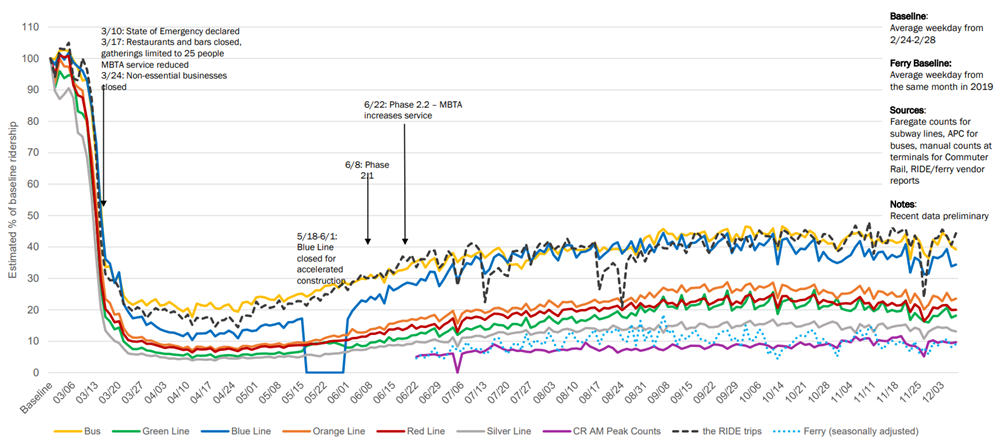
Public transit ridership has plummeted during the pandemic, but some parts of the system have rebounded meaningfully in recent months, due in large part to the different populations and communities they serve. Commuter rail (13 percent of pre-COVID ridership) and ferry (12 percent of pre-COVID ridership) experienced the greatest losses and remain low in the aggregate, while buses (41 percent) and net rapid transit (28 percent) rebounded more since their April low points. As seen below, Blue Line ridership is now similar to that of buses, while the Silver Line has hovered closer to commuter rail lows. These meaningful differences highlight the varied geography of transit ridership during the pandemic.
There are also important variations within transit modes. Even though the commuter rail has suffered heavy ridership losses, for instance, some workers still rely on its service. While many commuter rail lines connect higher-income suburbs to the inner core, some lines north and south of the city serve areas with higher shares of workers who do not have the ability to telework. Indeed, these lines, Middleboro, Newburyport/Rockport and Fairmount, were selected by the MBTA for ongoing weekend service in their December Forging Ahead proposal. The Fairmount Line was the only commuter rail line to be labelled an “Essential Service” in early proposals because of its high ridership and “transit-critical” population. While overall ridership is down to just 13 percent of pre-pandemic levels, commuter rail weekend ridership was estimated by the MBTA to be closer to 40 percent, even exceeding pre-pandemic ridership on the Fairmount line (137 percent).
Bus and subway lines, in contrast, have retained higher levels of pre-pandemic ridership, at 41 percent and 24 percent, respectively. However, differences exist not only by mode but also by line and station. While MBTA Red Line ridership remains low (-76 percent of 2019), station validations in Dorchester have nearly returned to normal. In addition, Charles/MGH station, which serves a high volume of essential workers, has maintained consistently high ridership throughout the pandemic.
The Blue Line has retained the highest ridership of all rapid transit lines (~40 percent of 2019) and shows a similar pattern—stations north of the city near where many frontline workers live (Suffolk Downs, Revere Beach) have retained the highest levels of ridership.
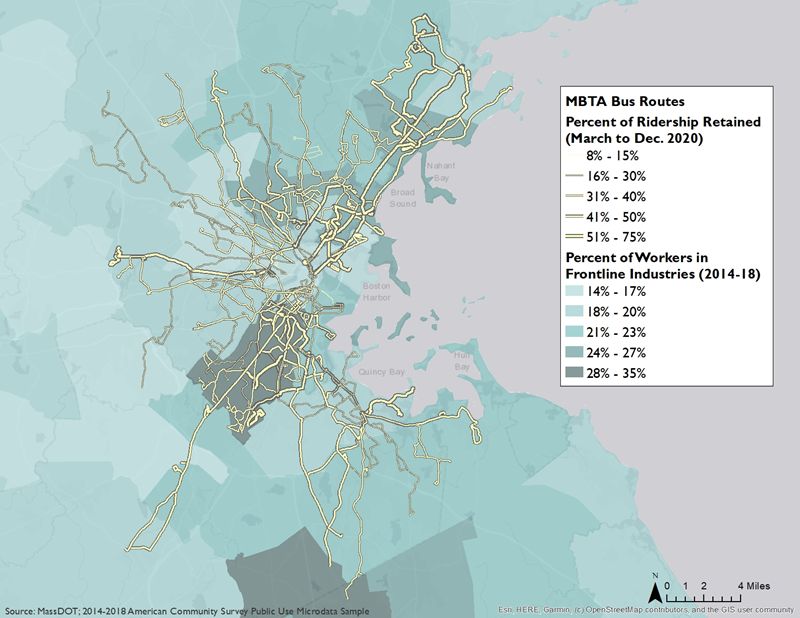
This pattern is most clear when looking at the most resilient form of transit—buses. The most durable bus lines (Routes 455, 216 and 24) serve communities immediately north and south of Boston. These areas have a higher concentration of workers in frontline industries that are more likely to be female, people of color and without a college degree.
Road traffic remains down in the urban core, but has risen elsewhere in the region.
Before the pandemic, Boston topped lists for one undesirable trait—the nation’s worst traffic. Two reports in 2019 estimated that Boston drivers lost 80 to 149 hours per year to traffic. However, all that changed as pandemic-induced shutdowns and stay-at-home orders began this spring. Traffic plummeted and in April was down to about 60 percent below 2019 volumes.
Road traffic has since risen unevenly across the region. Areas closer to the inner core lost the most traffic and have been slower to regain volume while areas outside of the core have recovered a larger share of pre-pandemic volume.
Source: MassDOT Traffic Count Data
Meanwhile, peak commuting traffic has reached pre-pandemic levels outside of the inner core but declines as you move closer to the inner core. This can be seen in MassPike gantry data. Westfield has already returned to pre-pandemic levels, but as you move east, traffic declines. In Allston, morning peak traffic remains roughly 54 percent below pre-pandemic levels.
As auto traffic rebounds, demand for personal cars has also grown. Nationally, used car sales hit a record high in July 2020 with $12.2 billion in reported sales. Interestingly, total car sales have not recovered to the same extent, indicating a higher demand for used vehicles over new ones. While low finance rates on auto loans made cars more accessible, the average amount financed for auto loans skyrocketed in the second quarter of 2020. Many news outlets reported fear of public transit and other shared modes of transit, such as ridesharing, as a cause for the increased demand. Indeed, a joint A Better City and City of Boston survey in November 2020 found that more Boston commuters plan to drive alone to work after the pandemic than before. An increased reliance on auto transit would negatively impact the region’s climate and public health by increasing congestion, air pollution and social isolation.
But it’s not preordained that we will return to pre-pandemic traffic levels. As Massachusetts reopens, well-functioning public transit, cycling and pedestrian infrastructure will be foundational to a just and equitable recovery. And a few communities, like the City of Boston, have used this period of decreased road traffic to accelerate the expansion of dedicated bus and bike lanes. It’s also possible that some meaningful share of the workforce will continue with remote work arrangements, easing some rush hour commuting. But how much these factors will ease pressures to return to the roads is very uncertain.
Housing has become especially unstable for lower-income families.
As detailed above, COVID-19–induced job losses have hit lower-income workers hardest, squeezing household budgets and potentially leading to increased housing instability. Tens of thousands of Massachusetts residents feared having to leave their homes due to eviction in October, and Black and Latinx households were more likely to be behind on rent. After the state eviction moratorium ended on October 17, evictions filings in Massachusetts steadily rose throughout November before exceeding pre-pandemic levels in mid-December. At the same time, requests for housing-related social assistance have remained high.
The geography of these new eviction filings echo patterns of job loss and largely amplify pre-pandemic patterns. Gateway Cities such as Fall River (340 filings), New Bedford (255), Lawrence (102), and Springfield (291) have seen high levels of filings, while communities such as Cambridge have seen relatively fewer filings (30). For up to date data on new filings by zip code, please visit this interactive tool hosted by the Massachusetts Trial Court.
An exception seems to be in the City of Boston, where new eviction filings remain low. The low filing counts could be due to the high share of subsidized housing in Suffolk County as well as the concentration of large affordable housing providers that have pledged to not evict tenants during the pandemic. Another reason could be city policy, specifically the large amount of funding that the City of Boston has dedicated to Emergency Rental Assistance (ERA) as well as a new ordinance requiring landlords to report Notices to Quit to the Office of Housing Stability (OHS), allowing OHS to direct resources to those households. Finally, it is possible that the softening market in many parts of Boston has increased landlord reluctance to evict because they fear it may be difficult to locate a new tenant.
State efforts to contain evictions have been mostly focused on mediation and new funding for Residential Assistance for Families in Transition (RAFT) that are intended to keep eviction filings from progressing to eviction executions. From the declaration of the Massachusetts COVID-19 State of Emergency until the end of November, the Department of Housing and Community Development has distributed $20.4 million in RAFT to more than 6,600 families in need.
Many municipalities have also formed their own ERA programs, using funds from philanthropic donations, the US Department of Housing and Urban Development, the CARES Act and municipal budgets. Eligibility for town ERA programs varies, but for many the funds are limited to residents who earn less than 80 percent of the area median income. While data has not been collected on the distribution of local-level ERA funds, there are currently at least 80 programs in operation across the state, with allocated funding ranging from $8 million in Boston to $20,000 in Sudbury.
Municipal ERA programs are another example of how cities and towns are experiencing the pandemic differently. Not only have some cities and towns seen a greater increase in resident need than others, but some have also experienced a greater loss of municipal revenue based on how they rely on local taxes and fees. Many cities and towns rely on hotel and meal tax revenue that has been decimated due to the pandemic, with some dependent on seasonal tourism revenue (such as Cape Cod towns) for much of their annual budgets.
In a rare trend, rental housing costs have declined in Boston while increasing in other parts of the region. Home sale costs have grown across the region.
Rental prices in Boston have declined during the pandemic with high-cost neighborhoods seeing the most dramatic reductions. Rents in Downtown Boston have decreased by 8 percent, while they remain fairly stable in lower-cost markets such as Allston/Brighton (-2.8 percent) and Quincy/Milton/Randolph (-0.1 percent). This rare trend likely reflects the dramatic reduction in the number of students, visiting faculty and other university affiliates, as well as shifting preference for more space as many jobs go remote. In addition, some number of lower-income families experiencing job loss due to the pandemic may have been forced to relocate to lower-cost markets.
Somewhat surprisingly, outside of the inner core, rents in many lower-cost markets have actually increased. Rent in Gateway Cities such as Fall River and Fitchburg increased by 11 and 8 percent, respectively. The inverse of Boston trends, this rise in rent could reflect renters no longer requiring job proximity due to teleworking and instead seeking larger spaces at lower costs. It could also reflect a growing number of renters seeking to move to those areas to reduce housing costs due to job and income loss.
Unlike rental patterns, which have been somewhat varied across the region, home sale prices and transaction volume have risen pretty uniformly across the region. The rise in home prices could be due to many factors, including those that pre-date the pandemic. Ultra-low interest rates, fewer houses for sale, a shift in family spending toward housing, an acceleration in the purchase of second homes, and the growth of personal savings could all fuel the growing prices. After an initial slow-down in the early months of the pandemic, home sales (condominiums and single-family homes) accelerated through the end of the summer and into the early fall. As of early December, home sale volume in 2020 was set to exceed 2019 totals.
One interesting story within Boston is that while rents are down across the city, median home prices in the for-sale market are actually up. Within the city, median home prices increased the most in low-cost markets such as Roxbury, West Roxbury and Mattapan. Boston’s share of statewide sales has only decreased slightly from 7.3 percent in 2019 to 6.8 percent in 2020.
Across Greater Boston, the entire price distribution has shifted upward, indicating that the change in price is not happening only in lower- or higher-end segments of the market.
Like rental housing, commercial properties in Boston have also seen a decline in demand, leading to increased vacancy rates and decreasing asking rents compared to 2019. An analysis of the Boston office market conducted by Newmark, Knight and Frank found that “few lease transactions [took] place outside of expiration-driven activity” in the third quarter of 2020 as building occupancy remained low due to remote work induced by the pandemic. Some landlords in Boston have begun to reposition office space for life science use, and the industry continues to drive activity in suburban markets. It’s very hard to predict how these patterns will change in the coming months and years, but it seems possible that if some meaningful portion of remote work becomes permanent that some of this newly vacant commercial real estate could be repurposed into much-needed new housing units in the region’s urban core.
Conclusion.
The unique dynamics of this crisis (especially the concentrated hit to the service sector) have combined with preexisting patterns of residential segregation and economic inequality, both of which have stark racial dimensions, to make this current moment especially inequality-enhancing. The pandemic has been referred to as the “great revealer” and a “portal” because it has not only laid bare and even worsened our existing inequities but also because it presents an opportunity to create an alternative future. Federal, state and local action taken over the past several months have helped ease some suffering—from strengthened food assistance programs to expanded unemployment insurance—but there’s much more to do in the coming months.


